Chip
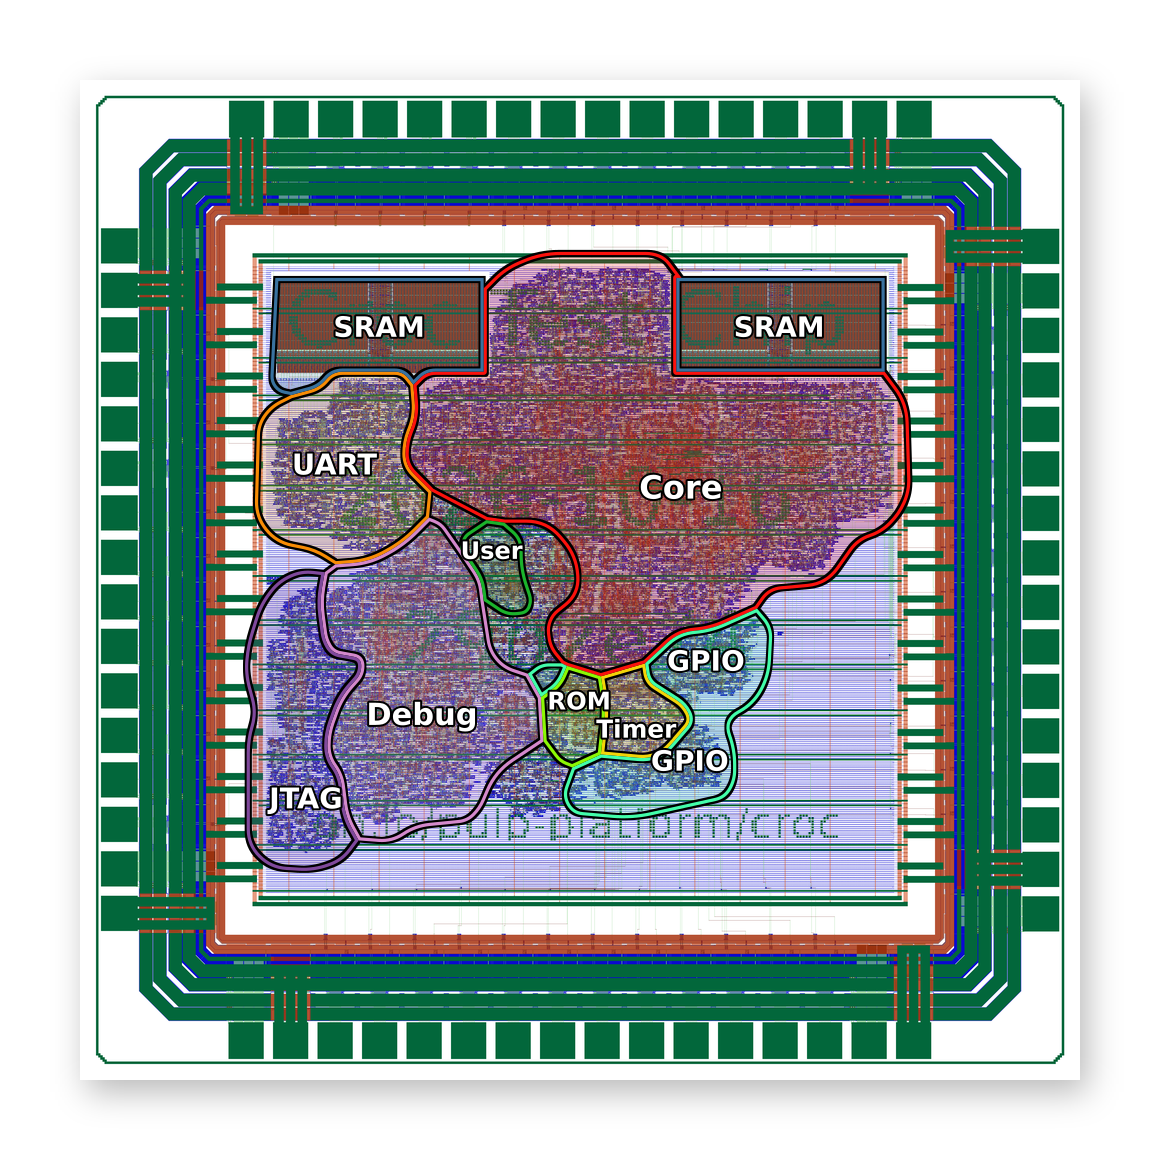
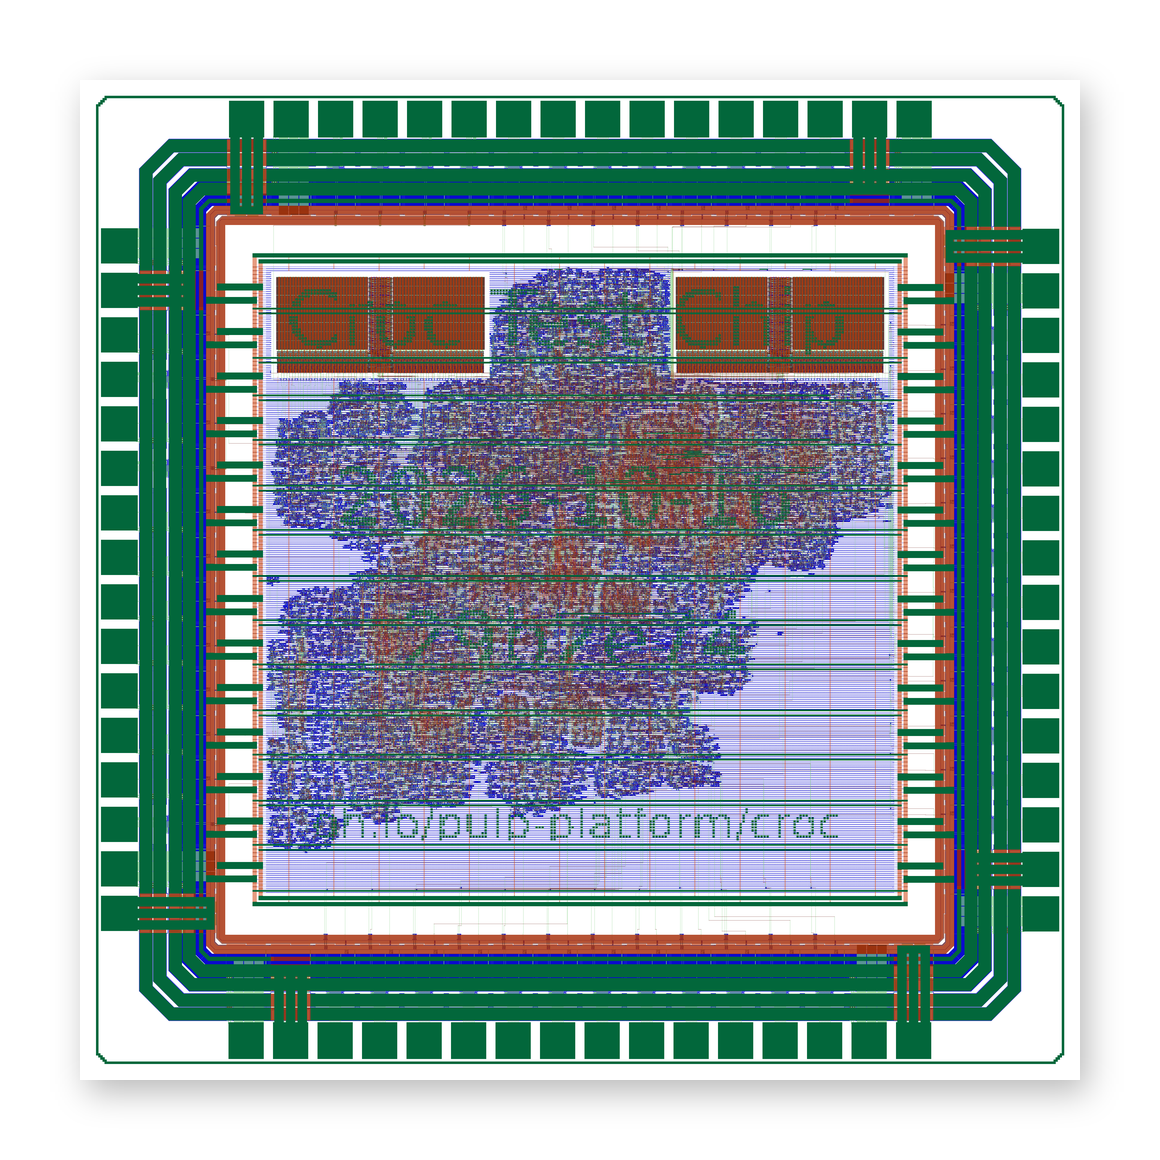
Area
| Cells | Count | Area (µm²) | Area (GE) |
|---|---|---|---|
| Logic cells | 25,184 | 316,141 | 56,006 |
| Macros | 2 | 159,440 | 28,245 |
| Signal + power pads | 64 | 921,600 | 163,265 |
| Total | 25,250 | 1,397,181 | 247,516 |
1 GE = 5.6448 µm² (NAND2). Excludes fillers, antenna cells, corners and bondpads.
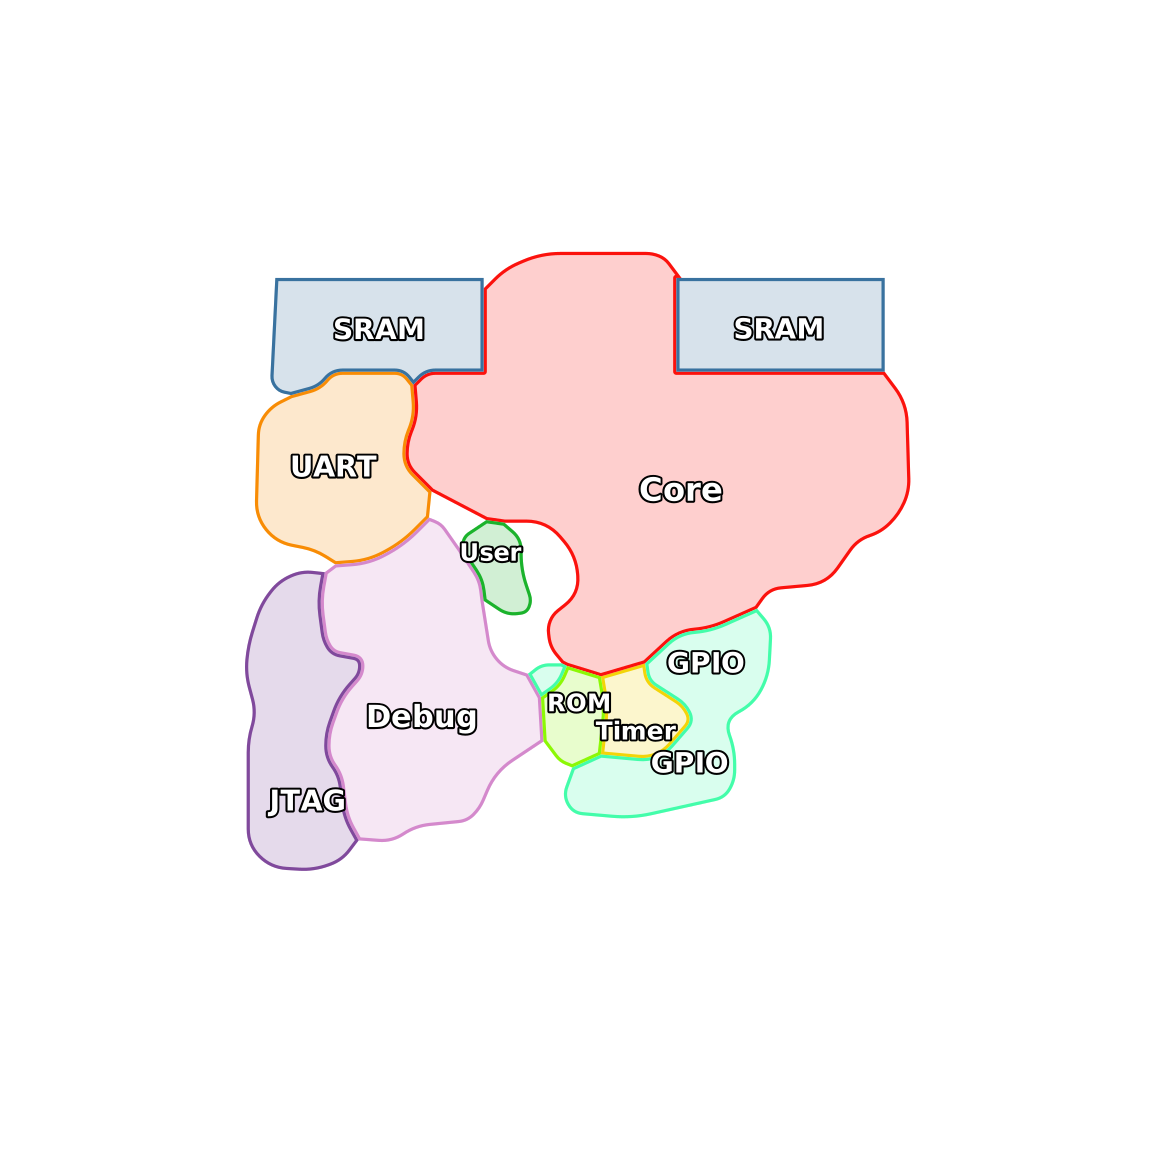
Module logic area
| Module | Cells | Area (µm²) | Area (GE) |
|---|---|---|---|
| Other logic | 6,505 | 140,191 | 24,836 |
| Core | 10,047 | 95,490 | 16,917 |
| Debug | 3,421 | 30,094 | 5,331 |
| JTAG | 2,020 | 19,411 | 3,439 |
| UART | 1,362 | 14,499 | 2,569 |
| GPIO | 974 | 9,039 | 1,601 |
| Timer | 463 | 4,225 | 749 |
| ROM | 323 | 2,554 | 453 |
| User | 69 | 638 | 113 |
Logic cell footprints. Macros excluded.
Design
| Metric | Value |
|---|---|
| Clock target | 100 MHz |
| Worst setup slack | +0.01 ns |
| Setup / hold violations | 0 / 0 |
| SRAM | 4 KiB |
| Core area | 1,938,498 µm² |
| Core utilization | 26.23% |
Verification
| Test | Exercises | RTL | Netlist |
|---|---|---|---|
| Default configuration | |||
| helloworld | Boot, SRAM load and UART transmit | Pass | Pass |
| print_config | Configuration register readback | Pass | Pass |
| iDMA configuration | |||
| test_clint | Time counter, compare and software-interrupt registers | Pass | Pass |
| test_compute | Integer arithmetic, shifts and logic | Pass | Pass |
| test_gpio | Output, pin loopback and toggle | Pass | Pass |
| test_idma | SRAM copy and 2D transfer | Pass | Pass |
| test_interrupts | Trap vector and handler dispatch | Pass | Pass |
| test_obi_timer | Count, compare and auto-reset | Pass | Pass |
| test_soc_ctrl | Boot address and target | Pass | Pass |
| test_uart | Transmit and internal loopback; not external RX | Pass | Pass |
DRC
Pass0 violations
Minimal metal, pin, angle and forbidden-geometry checks. Off-grid and recommended checks excluded.
Runtime
Full Flow
Design flow; backend wall time. Simulation branches are not in the total.


- Synthesis, 2.4%
- Floorplan, 0.1%
- Placement, 7.4%
- CTS, 0.7%
- Routing, 74.3%
- Finishing, 0.4%
- GDS + seal, 0.2%
- Minimal DRC, 14.4%
Backend stage wall time2h16m25s
CI reports: Full Flow · Simulation · FPGA
Durations
| Stage | Seconds | Share |
|---|---|---|
| Synthesis | 198.741 | 2.4% |
| Floorplan | 8.335 | 0.1% |
| Placement | 605.780 | 7.4% |
| CTS | 58.120 | 0.7% |
| Routing | 6084.512 | 74.3% |
| Finishing | 29.437 | 0.4% |
| GDS + seal | 17.615 | 0.2% |
| Minimal DRC | 1182.464 | 14.4% |
| Backend stages | 8185.004 | 100% |
Measured stage wall time. Setup and PDK downloads excluded.